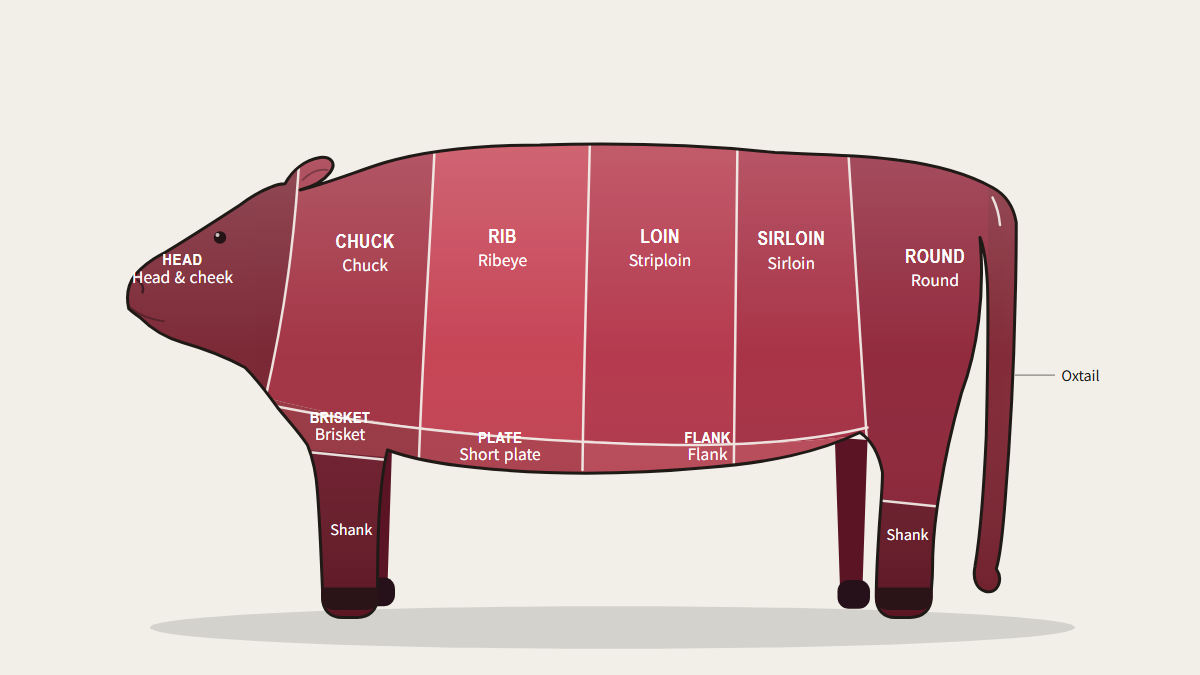
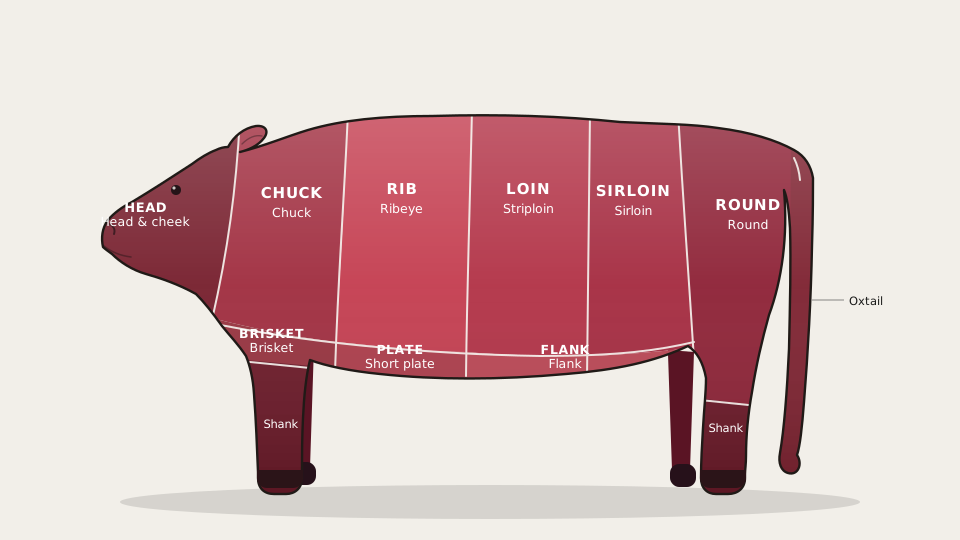
The chart is the navigation
Hover a cut for a summary, click to open its page — local names, dishes it suits, recommended doneness and how to pick it at the counter.
Marbling is not something you explain in words
The BMS 1–9 scale, drawn rather than described. Japanese A5, Korean 1++, USDA Prime and Australian MSA all sit on this one axis, so grades from different countries can finally be compared by eye.
Doneness is a colour, not a guess
Drag the slider and the cross-section repaints along the real myoglobin curve. Core temperature and resting time move with it.
One axis ties the whole atlas together
Myoglobin shifts with oxygen and heat: deep purple-red when deoxygenated, bright cherry when oxygenated, grey-brown once fully cooked. Those three points are this atlas's entire palette — and the shared visual language of the freshness, doneness and ageing pages.
Temperatures are guidance for whole-muscle cuts. Ground meat and poultry need 71°C / 160°F throughout.
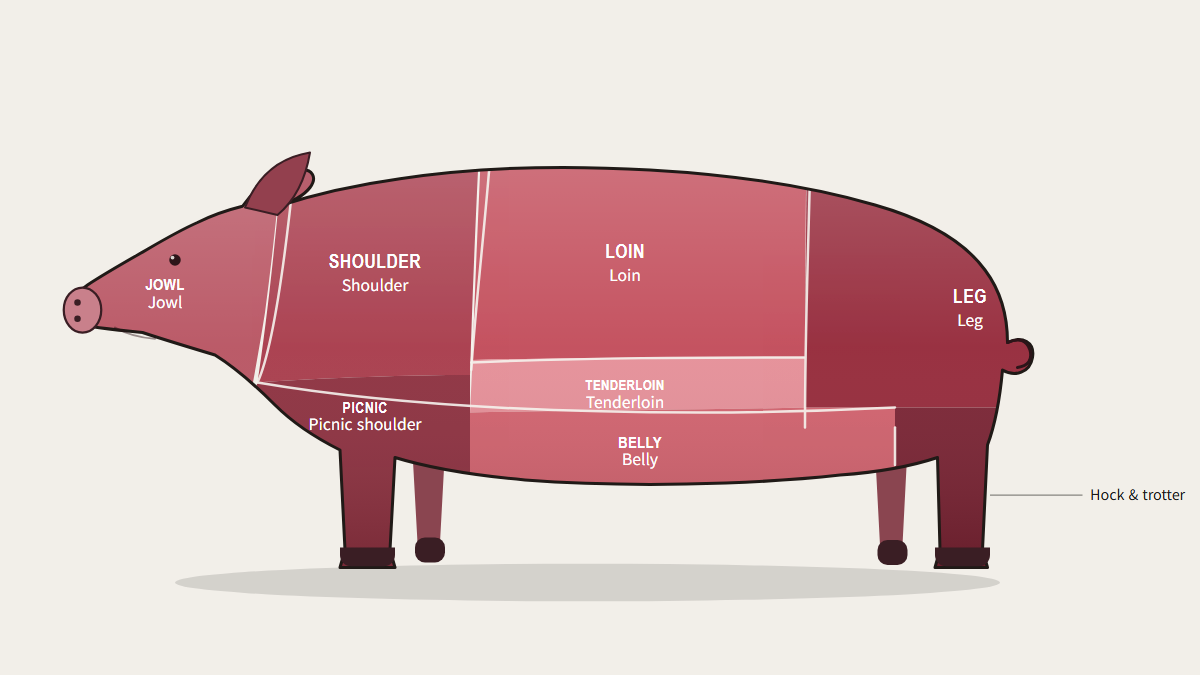
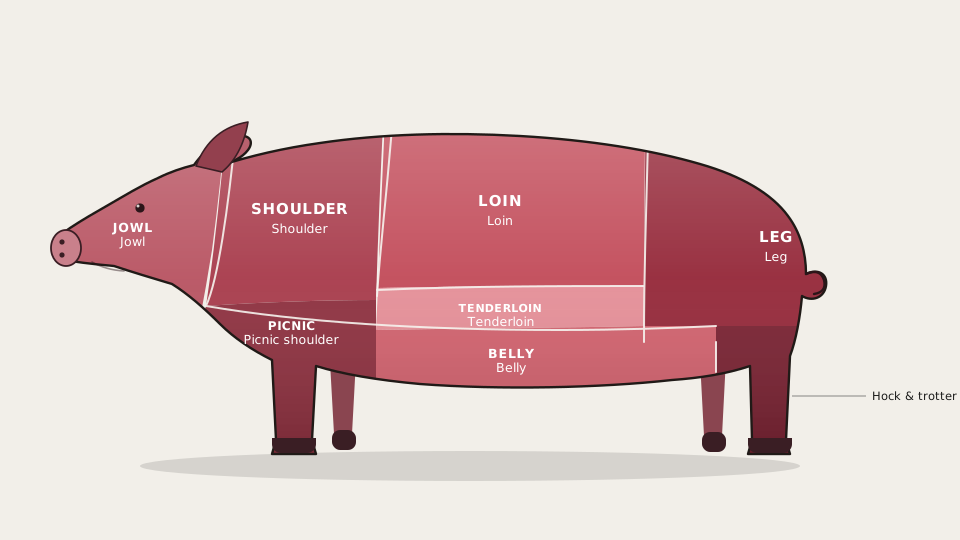
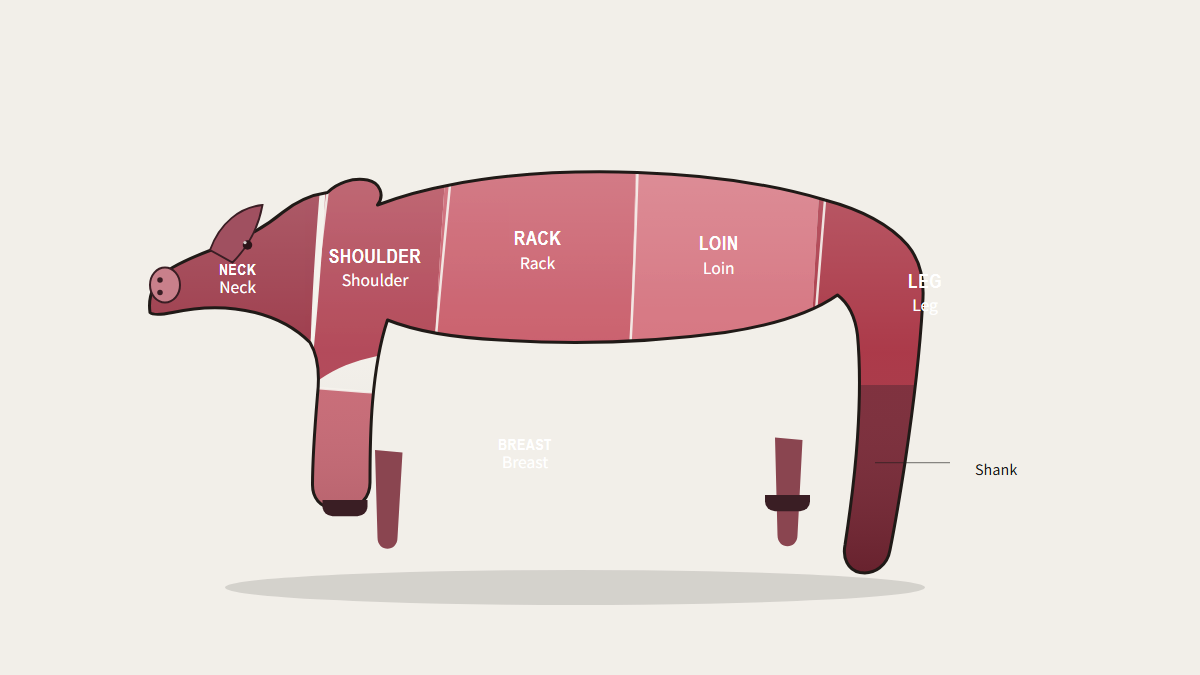
Pork is a fat map before it is a meat map
On a pig, where the fat sits decides everything — which is why the belly became bacon and samgyeopsal on opposite sides of the world, and why the same loin is a schnitzel here and a tonkatsu there.
Lamb is a map of feast days
From Easter roast to Eid shoulder, from rack for two to shank that wants hours — lamb cuts are sized for occasions. Fat caps and bone keep flavour in a way lean beef rarely does.
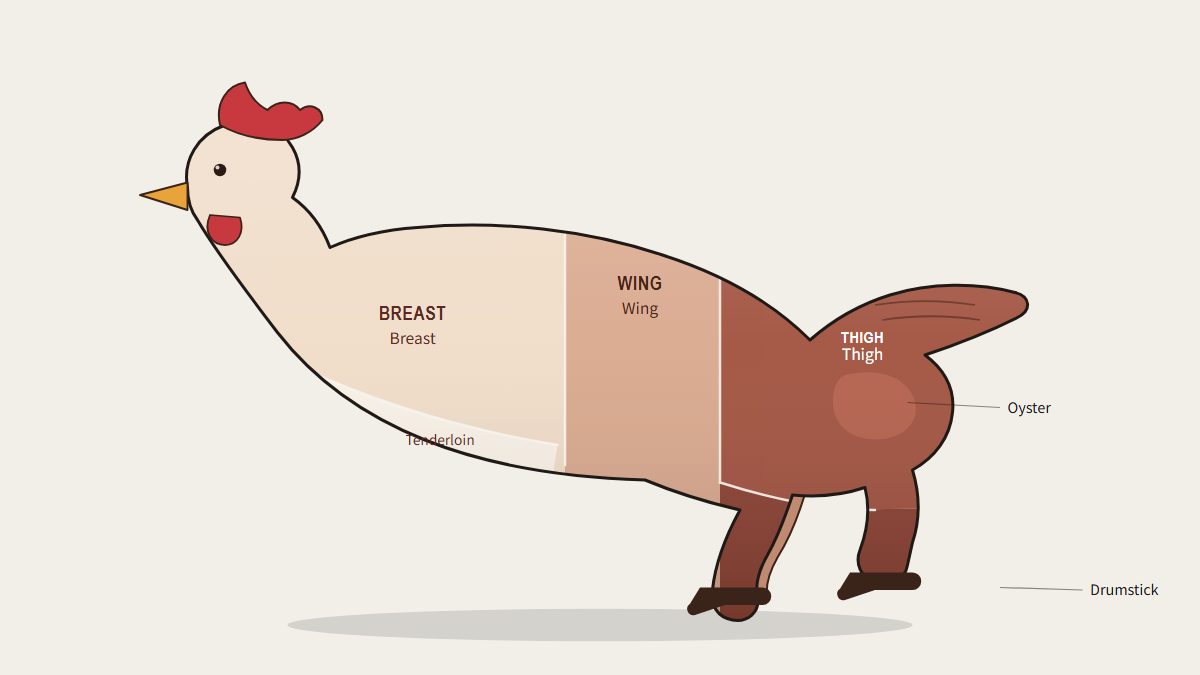
A chicken is really seven different meats
White muscle for short bursts, dark muscle built for standing all day. That single split explains why the breast dries out at the temperature the thigh needs, and why no bird should be cooked as one thing.
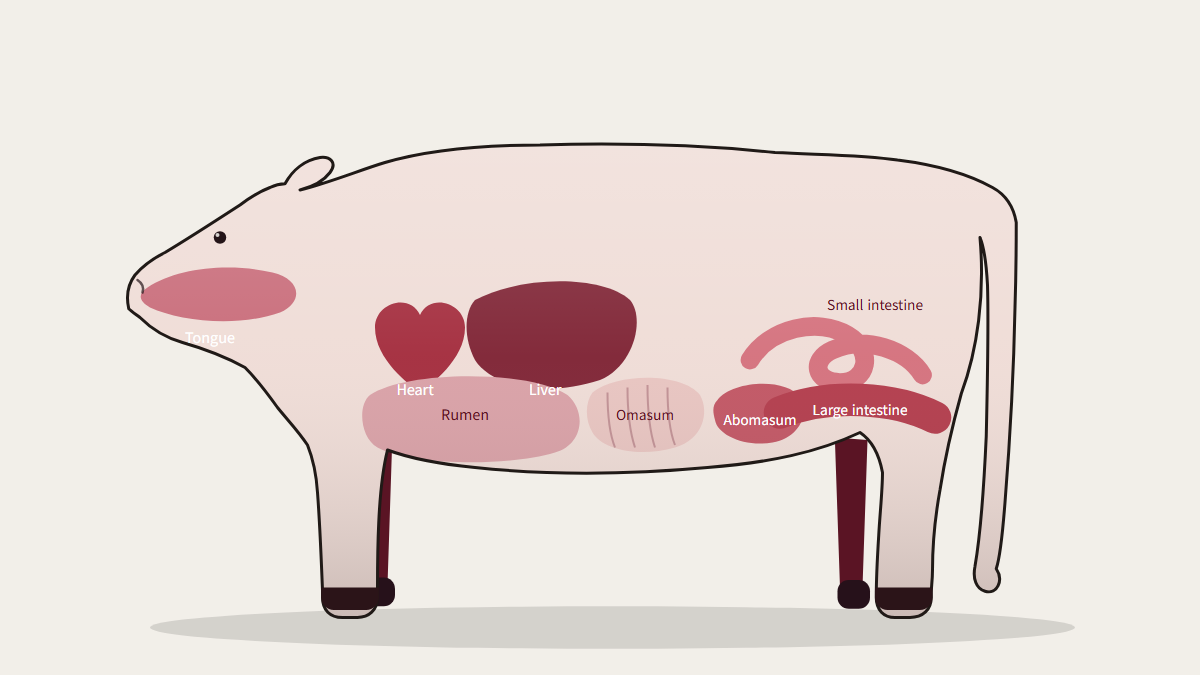
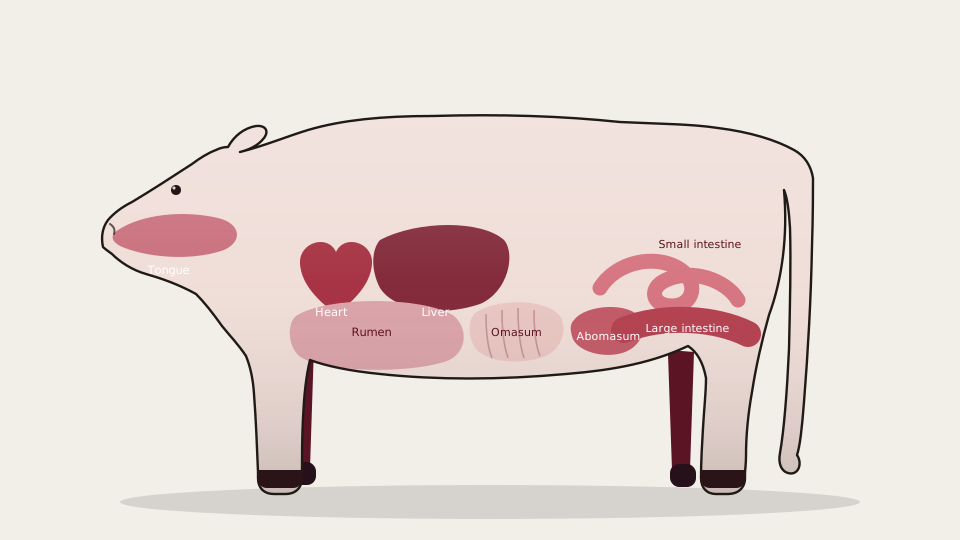
Gopchang, makchang and daechang are three different organs
The names blur together in menus, but gopchang is small intestine, daechang is large intestine, and makchang is the fourth stomach. Fat, chew and cook time are completely different — seeing where each sits in the animal settles the confusion at once.
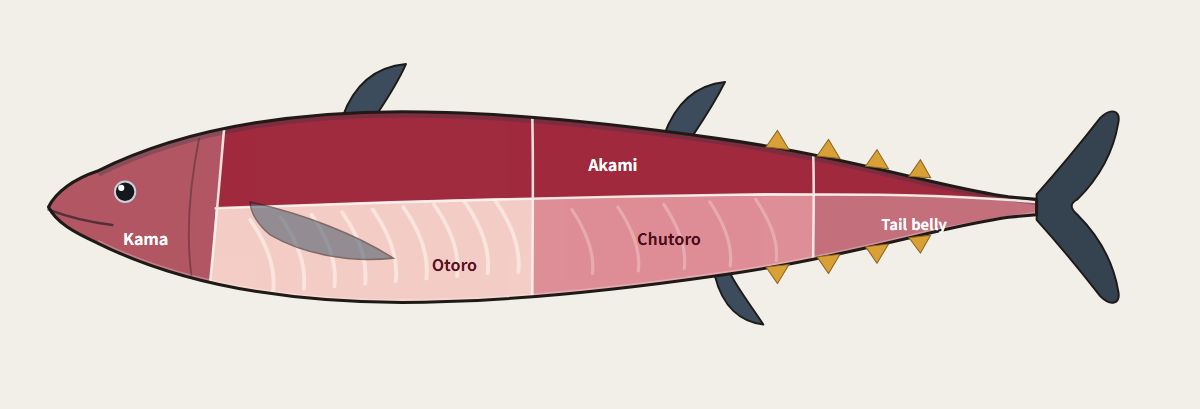
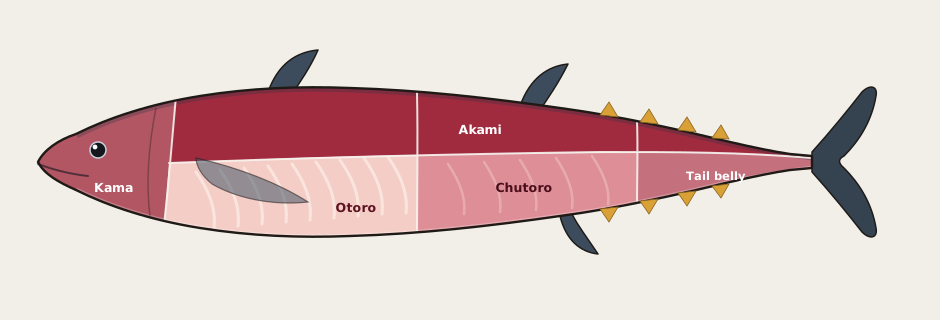
Raw fish needs its own axis
The way a single tuna divides into otoro, chutoro and akami follows a different logic from beef butchery. Fish are modelled on fat content and position rather than muscle group.
What should I buy?
Answer a few preference questions and the atlas ranks every cut that fits — same meters the charts already use, no black box.
Explore →
Dishes by cut
You know the dish. The atlas maps it back to the primal — galbi, tonkatsu, shawarma and more.
Explore →
Butcher names
Aguja, sot-l'y-laisse, gopchang — the counter names that confuse travellers, listed next to the atlas cut.
Explore →
Cut swaps
Counter substitutions that keep the cooking method honest — not random swaps.
Explore →
Doneness by animal
Beef can stay pink. Poultry cannot. One slider does not fit every species — use the right axis.
Explore →
Find a cut by cooking
You know what you want to cook — not which cut to buy. Pick a method and the atlas ranks every cut that scores well for it.
Explore →
Calories & protein
Change the cut and calories can triple. Here are 38 cuts side by side on a 100 g basis.
Explore →
Storage, thawing & aging
Fridge days, freezer months, and how to thaw safely. Most meat is wasted in storage, not in the pan.
Explore →
Portion calculator
Pick a headcount and an occasion and you get a shopping weight. Grill nights and soup nights use very different per-person baselines.
Explore →
Grading systems
BMS is the shared visual axis. Hanwoo, Wagyu, USDA and MSA hang different labels on the same fat — here is how to read them without mixing the systems up.
Explore →
Same craving, different animal
Ribeye vs pork belly, lamb rack vs beef rib — cross-species comparisons for the decisions shoppers actually make.
Take the chart with you
Every chart on this page is also a standalone image, labelled in this language. Save it to your phone for the butcher's counter, or print it for the kitchen wall.